| Products: | |
Address:
Čarnojevića st. 4/21 18000 Niš
Serbia
Tel.:
+381 18 244282
+381 61 2340396
borkojov@yahoo.com
| HEARTVIT-PC ergometer system
|
||
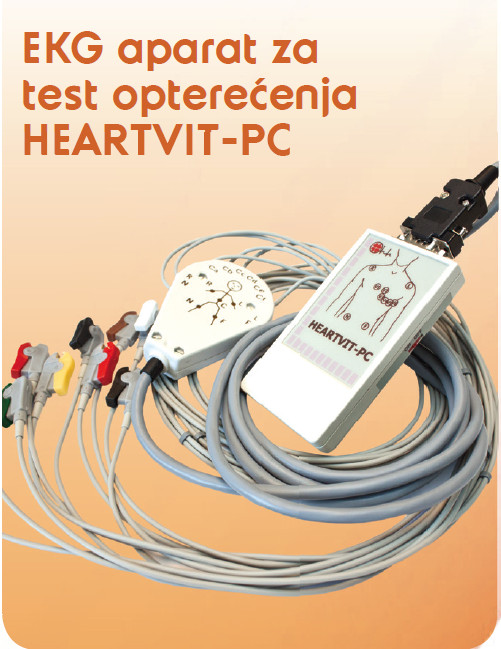
12-channel ECG stress & resting system. Efficient, accurate, reliable cardiac stress testing for the primary care office. The PC becomes the ECG machine. A real-time ECG is shown on your monitor. 12 Lead ECG storage is fast and simple. |
||
|
||
| HEARTVIT-PC ergometer system
HEARTVIT-PC module characteristics
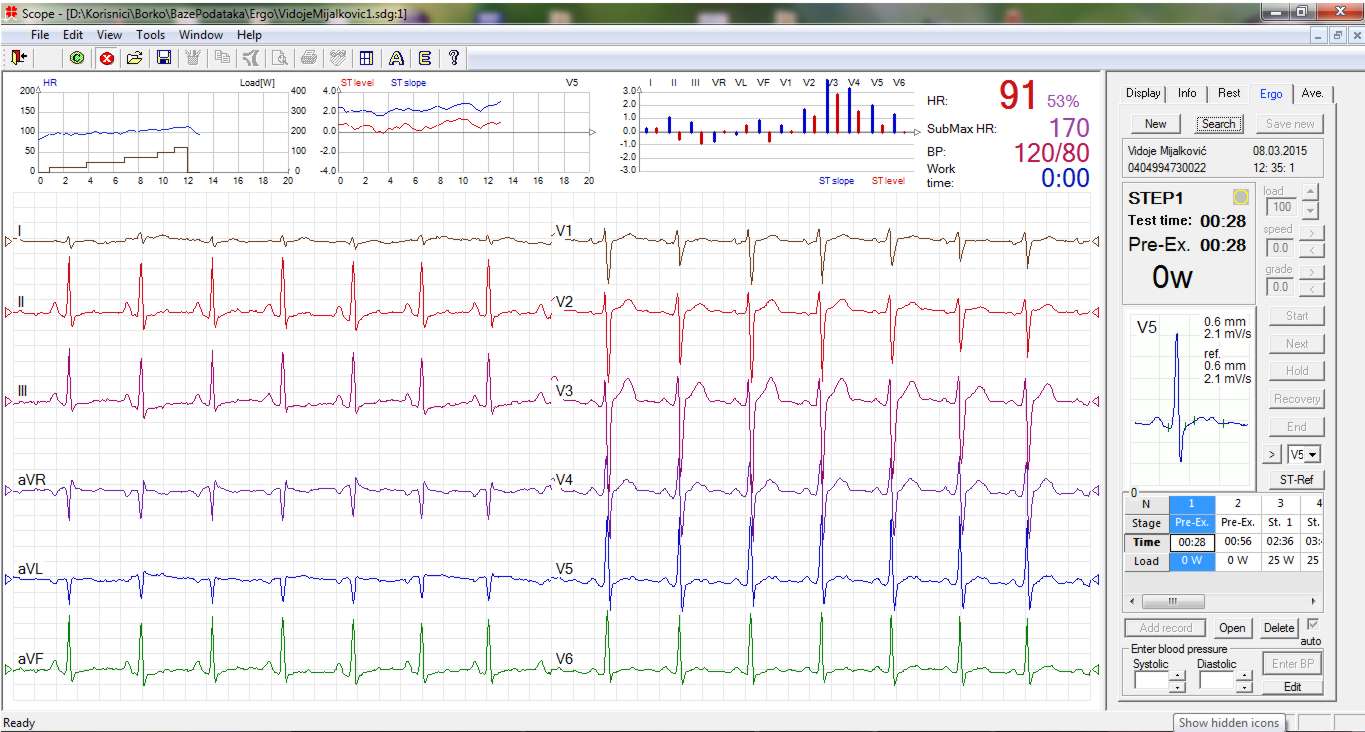
The Scope ECG software characteristic The program supports standard exercise protocols for treadmill (Bruce, Balke, Naughton, Ellestad, Cooper). Tthe doctor can define his/her own test protocols on treadmill or ergometer bike. The protocol consists of pre-exercise stage, several main stages and recovery stage. The transition to the next stage can be initiated automatically, after the stage-defined time is elapsed, or manually (by pressing the Next button). The Scope's main window during the test is shown on figure 3. The user can select the set of leads, change the amplitude and speed, set the signal's appearance in one or two columns. During the test, the program gives:
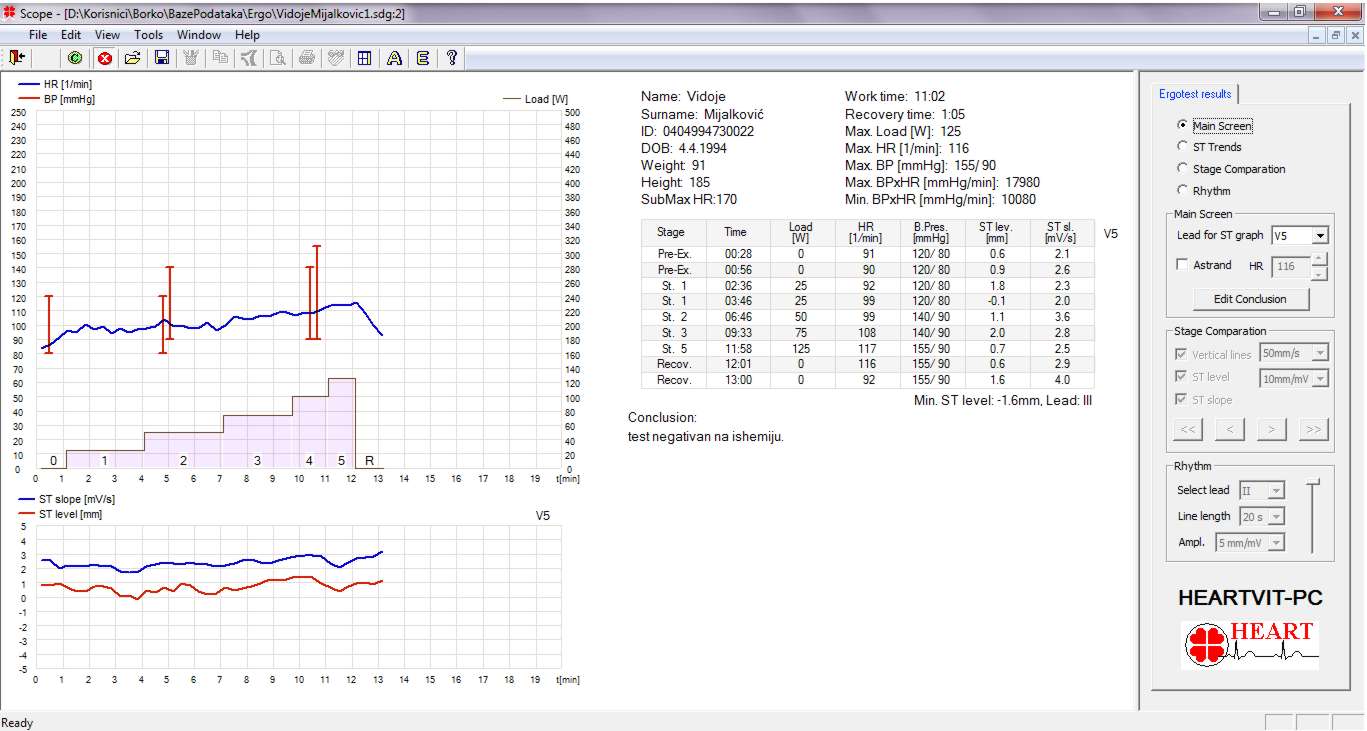
After the test is finished, the program displays:
|
Download HEARTVIT-PC ergometer system product brief |
|
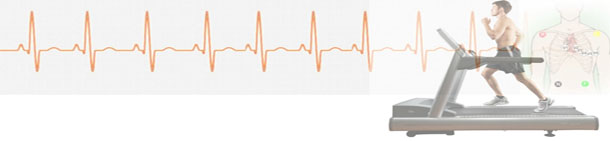
Figure 1. HEARTVIT-PC stress test system
Figure 3: Scope during the exercise test
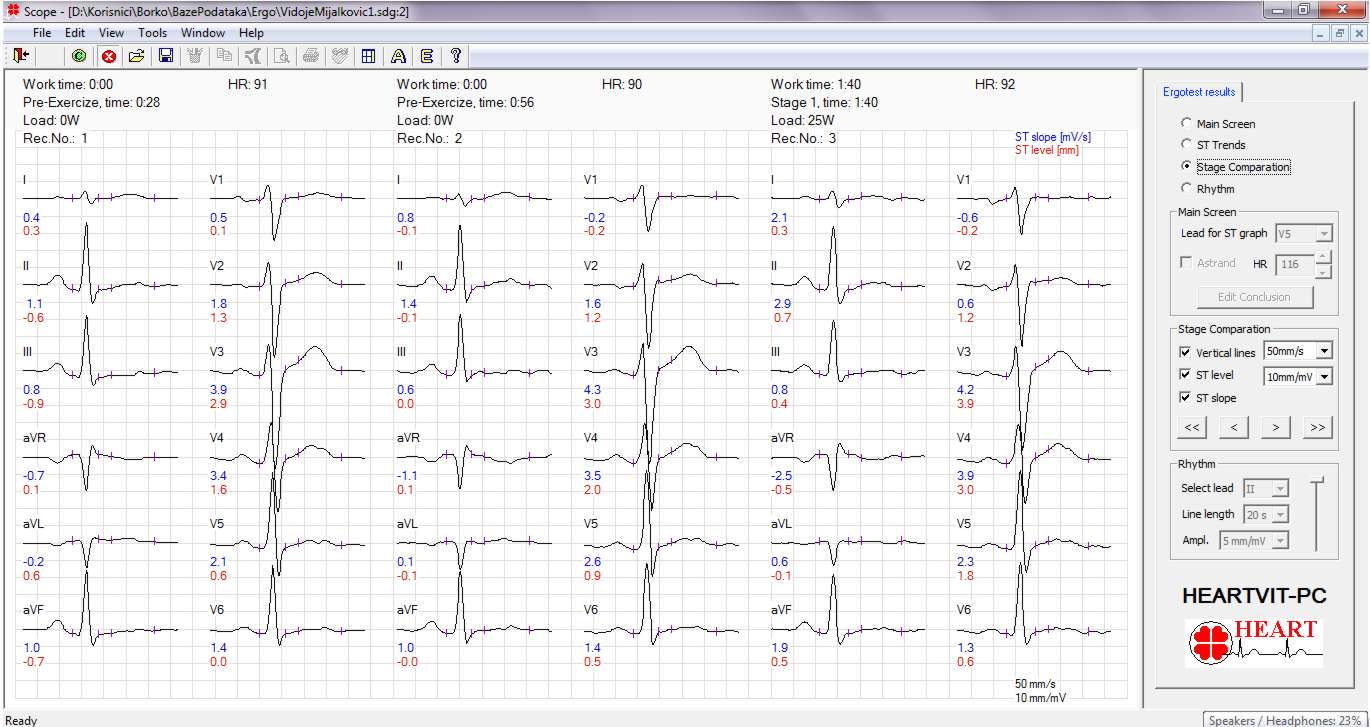
Figure 4. Main window
Figure 5. Stage Comparison window
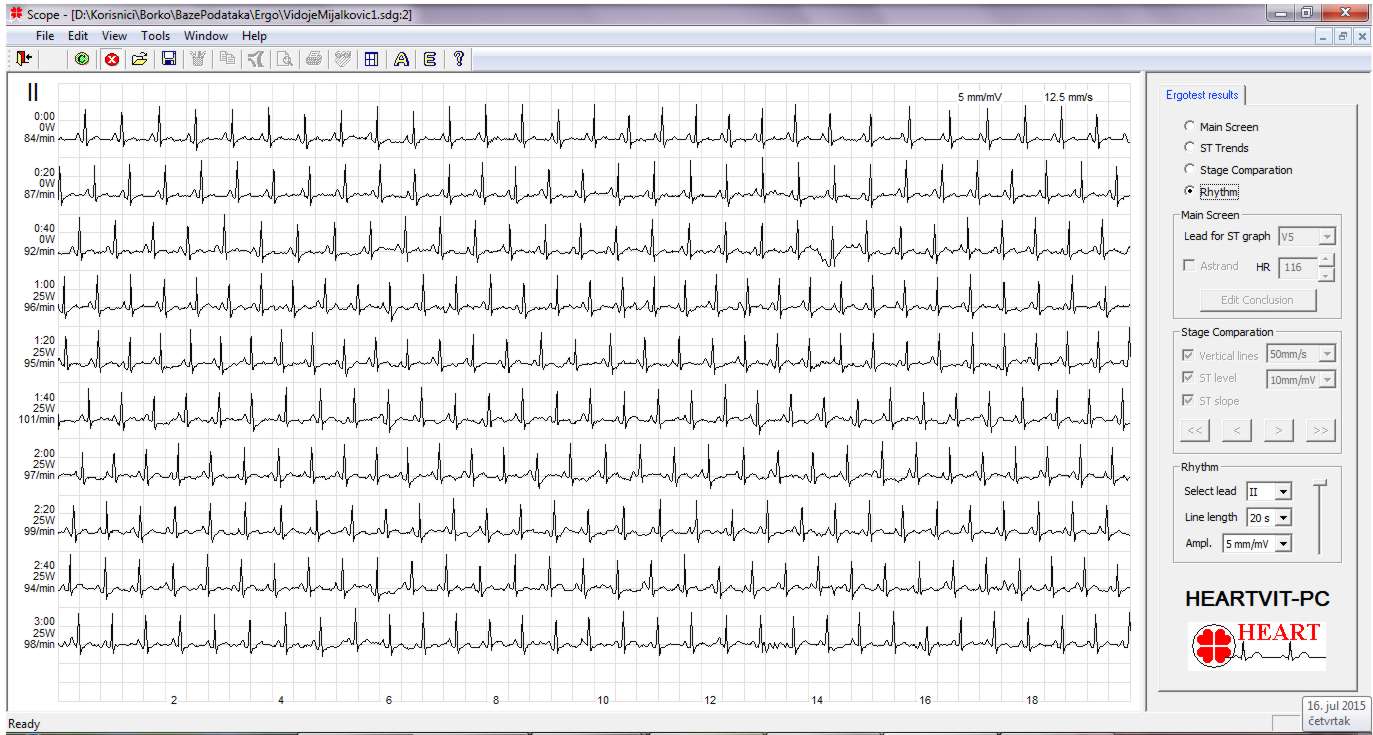
Figure 6. Rhythm window
|
||